

Under the recast Energy Efficiency Directive, a company’s energy obligations depend on how much energy it uses, not its size. Any business that consumes over 10 TJ (about 3 GWh) a year on average now requires an energy audit at least every four years unless it runs an energy management system. The first audit was due 11th October 2026. Companies above 85 TJ (about 24 GWh) must implement an energy management system by October 2027. Each audit must also lead to an action plan and be published in the annual report with its implementation rate. A utility bill shows how much energy the site used, but not which line, machine, shift or product used it, nor the operational or equipment states that drive consumption. The solution is to connect energy and production data, which is where most plants struggle.
Why energy data is scattered
Most plants have grown over decades and use equipment from many vendors. Meters report over Modbus, M-Bus or OPC UA, PLCs use their vendors' own protocols, and MES keep orders and part counts in a database. Each system has its own owner and naming convention, so the same line can be "L3" in one system and "Line_03" in another. The custom scripts that connect them often break when something changes upstream.
Take a simple question: How much does Line 3 cost us to run today? The answer needs information from four different sources: the energy meters, the PLC, the MES and the utility's time-of-use tariff. None of them share the same semantic structure, so assembling the answer manually can take hours.
Energy per good unit: the key metric
The most useful metric is energy per good unit, which is the total energy consumed divided by the number of products that pass QC. Part of a machine's energy consumption relates to its output, but part does not. This is because hydraulics, heating, cooling, and controls draw power whether or not parts are made, so every OEE loss has an energy cost.
What are the links between the four data sources? The first link is an asset model that records which meter measures which machine, line, and product. Without it, the same KPI means different things. One site's kWh per part might include compressed air, while another's does not, so shared loads need an agreed allocation rule. The second is a common time base. Meters are read at fixed intervals while PLCs and the MES record events, so all sources need one synchronized clock before a meter interval can be split at each state change or order boundary.
With both links in place, the PLC's machine state shows how much energy a line uses while producing, idle, in set-up or stopped. The Line 3 question then becomes a query: metered consumption, split by the orders, and states recorded over the same intervals, priced at the tariff that applied at the time. Metering the line feeder and the largest consumers is often enough to start.
Imagine a shift on a line that draws 30 kW whenever it is switched on, plus 0.04 kWh per part. At 100% OEE, the 3,400 good parts would have needed 306 kWh but the actual shift used 380 kWh. This is because an hour of stoppage and 30 minutes set-up time with the line switched on used an extra 45 kWh, while running at 90% speed used 19.5 kWh, and 110 rejected parts used 9.9 kWh - totaling 74 kWh of extra energy due to OEE losses. At an OEE of 71%, each good part used 0.112 kWh instead of 0.090 kWh - roughly a quarter more. When measured per unit, cutting energy waste and raising throughput becomes the same problem. ISO 50001 expects energy performance indicators to be normalized for relevant variables that significantly affect consumption. In manufacturing, the main variable is usually output. A plant that doesn’t link energy to production cannot normalize, which makes it impossible to tell whether lower consumption came from an efficiency measure or from a quieter month.
Why spreadsheets are not scalable
Plants that report energy per line often do it manually, where an engineer downloads interval data from the meter vendor's portal, matches the timestamps against an MES export, and assembles the result in Excel. Any gaps, renamed tags, and daylight-saving shifts are corrected by hand. This is manageable if preparing for an audit, but the numbers are hard to trace.
The manual approach fails when weekly reports are required, or when management asks why consumption spiked at 3 a.m. on a Tuesday.
New software platforms are supposed to fix this, but many add complexity instead. Someone has to connect the plant systems, build the asset models, define the KPIs and keep the integration running when a machine is replaced or a PLC program changes. That work commonly falls to OT teams, whose main job is keeping production running, but few are staffed for cloud operations. Every new report then becomes another project for the same people. IT security teams are also wary of anything that opens the control network.
What works is a setup that can be installed on existing equipment, runs without constant attention, defines the data model once, and lets the people closest to the process build their own views without code.
Collecting data at the edge
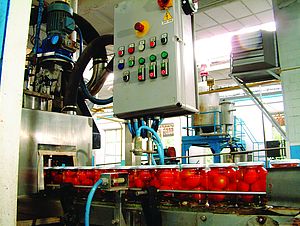
The graphic in picture 3 shows a reference architecture in which an edge gateway reads meters, sensors, and devices on a plug-and-play basis. The edge data layer handles data access, normalization, and integration: reading values, converting units and names into one model and adding context such as asset, line, and product.
The gateway sends the data over an encrypted, outbound MQTT or HTTPS connection, so no inbound access to the control network is needed. In the cloud, the IoT platform receives and stores the data as time series mapped to asset models. Access control limits who can make changes, and an audit log records the changes.
An analytics application calculates energy and cost per unit alongside OEE. Machines without a digital interface can use secondary sensors, so nothing needs to be replaced or reprogrammed.
What line-level data makes possible
With energy and production data combined into one model, anomalies show up in realtime rather than on the next energy bill. This could be a line drawing power at the weekend, a compressor running with no production, or a machine using more energy per part than last month. Using a standard KPI definition means all lines and sites can be directly compared, and a model built for one line can be reused on others.
The same data serves compliance. Emissions can be calculated from the measured consumption per line and product data. An audit shows what a plant can document at one point in time, while an energy management system requires the same evidence all year. With energy per unit tracked like OEE, production can be planned with energy targets in mind.