Titan Enterprises. Flowmeters have become essential measuring devices used in a vast array of different industries. From commercial applications measuring the fuel feeding industrial boilers, for flow monitoring of lubricant supply lines for wind turbines, to dosing chemicals for agricultural sprays.
Domestically, flow meters have also become intrinsic to our lives. Installed to manage the dispensing of beer or coffee, flow meters are an integral component in bar taps, and are built into washing machines and dishwashers to meter efficient water usage.
Turbine Flow Meters
Turbine flow meters are invaluable measurement tools and their repeatability and linearity are the key elements which determine the flowmeter’s performance and overall accuracy. The linearity, repeatability and ultimately accuracy, of the turbine flow meter depend on several variables including pressure, temperature, density, friction and compressibility of the fluid. As such, both the mechanical properties of the flow meter and the physical properties of the fluid combine to influence the performance of the flow measurement device.
Turbine flow meters can be either radial or axial where liquid passing through the flow device causes the turbine to rotate. As the blades of the turbine rotate, they pass a sensor and are detected either optically or, more frequently, magnetically, and converted into electronic pulses. The pulse frequency (Hz) produced is proportional to the flow velocity.
In the industry, a number of terms are used when looking at the operation of a flowmeter. The following descriptions aim to put the terms into an accessible format and should not be read as the strict definitions as stated in published standards.
The K-Factor
The K-factor is the number of pulses per volume (by litres) calculated by dividing the frequency of electronic pulses by the flow rate. The K-factor of a turbine flowmeter is unique to that individual device, although batch produced meters are likely to have very similar, although not identical, K-factors.
When the flow meter is calibrated at specific flow rate and flow range values (as determined by its design), the required repeatability and linearity are measured to give the K-factor for each point of measurement. The calibration certificate for that specific flow meter records the actual performance expected under ideal installation conditions.
To illustrate, a turbine flow meter may have a flow rate of 2 litres per second (120 l/min) and give an output frequency of 2000 Hz. This means that 1000 pulses are generated for each litre of fluid that is measured. Titan will typically calibrate at different flows across the meters entire flow range to determine the best overall K-factor for that particular flow device. This K-factor is used for the monitoring instrumentation, such as Titan’s Pulsite Solo® display, and the repeatability and linearity are calculated by this calibration for the flow range.
Electronic flowmeters such as ultrasonic, electromagnetic or Coriolis flow devices are usually programmable with a preferred K-factor to suit the application. As an example, Titan’s Atrato® and Metraflow® range of ultrasonic flow sensors are able to accurately measure to 1% of reading with operator configurable K-factors to 10KHz.
Calibration uncertainty
Calibration uncertainty is the total uncertainty of the reference measuring equipment used to calibrate a device, such as a flow meter. How good this is forms the basis of all the performance claims. It is a figure rarely quoted other than by certified calibration houses. No calibration, even fully traceable ones, can be absolute as there is an uncertainty on every single measurement all the way back to the National Standards. The very best calibration houses claim an uncertainty of ±0.02% but more typical is ±0.1%. This is the base value on which all the other accuracy statements are founded. If the uncertainty here is ±0.2% the flow meter cannot be specified as being more accurate than that, even if the repeatability and linearity are less than ±0.1%, as the uncertainty of the calibration equipment and methodology is the overriding determinant.
Repeatability
Repeatability is the ability of a flow meter to give the same result on repeated runs with the same operating conditions. Titan’s small turbine flow meters are successfully employed in batching processes and dispensing applications particularly within the food and beverage, chemical and laboratory sectors, as they have excellent repeatability (±0.1%).
This is not to be confused with accuracy or linearity. Without excellent repeatability, a turbine flow meter cannot achieve good performance. Normally, multiple points are taken at each calibration point to check the repeatability of the device although these are not always reported on the calibration certificate. A highly repeatable flow meter that can be calibrated in-situ are ideal for batching applications where any process offset can also be reliably accounted for.
Accuracy
Accuracy is the term used to specify the true reading of an instrument (high accuracy), or indeed the deviation from the absolute truth (low accuracy). Accuracy is generally used as a qualitative term, giving an indication of the quality of the instrument. The accuracy figure stated should include linearity, repeatability and calibration uncertainty.
Linearity
Linearity is usually defined by stating the maximum deviation of the reading over a stated range (e.g. ±1% of flow rate). It is the ability of the flow meter to remain within specified limits over its entire flow range determined by its design.
The standard way of expressing linearity is error of reading. A frequently used alternative in some industry sectors is percentage of full-scale deflection or FSD. The following charts illustrate examples of FSD and of reading linearity.
FSD linearity
This meter shows a reasonable reading. Plotted in this form (Figure 1) the indicated flow versus the actual flow shows almost a straight line. The meter is specified as ±2% of full-scale accuracy with a full-scale range of 100 l/min. So a ±2 litre per minute tolerance applies over the whole operating range, even minimum flow. If the number of pulses per litre for the same meter is plotted against the flow rate a different story becomes clear (Figure 2).
Using the same meter, the plot in Figure 2 illustrates the increased error of reading at low flow rates. We can liken a ±1% FSD specification to using an indicator with only 0-100 resolution digital display. All of the readings are in 1 unit steps so at full flow the meter is measuring ±1 litre per minute. The same is true at 1 litre per minute which could be 0 or 2, i.e. ±1 l/min equivalent to 1% FSD linearity. One litre per minute accuracy at both 100 or 1 l/min.
Although a 100:1 flow range and a 1% FSD linearity is not normally claimed, this example provides a good illustration of the potential problem. Even a 10:1 flow range with 1% FSD would give a 10% permissible error at the specified minimum flow i.e. 10 l/min ±1 l/min.
This indicator analogy also demonstrates the importance of associated instrumentation and displays which is not discussed here.
Of reading linearity
The graph plotted in Figure 3 uses the same flowmeter data as the FSD illustration above. In this case the error lines are shown as a percentage of reading. It is clear that the example flowmeter “drops out” of the required accuracy between 10 and 20 l/min for an of reading accuracy of ±2%.
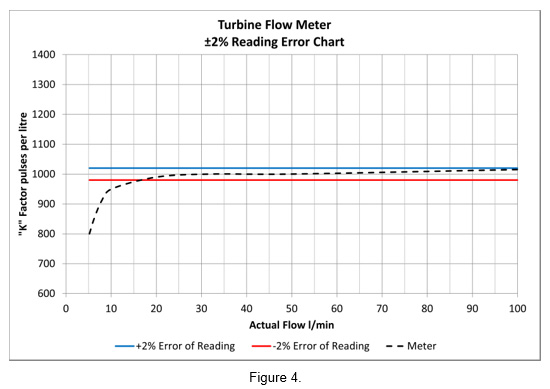
The graph in Figure 4 better illustrates the true situation with the same flowmeter used in Figure 1. The flow meter is close to the maximum acceptable limit at full flow but drops outside the ±2% of reading specification at around 17 litres per minute.
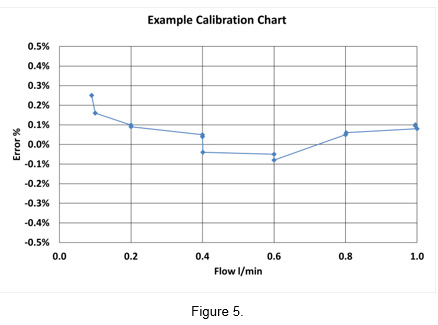
A typical calibration graph (Figure 5) issued by a manufacturer would normally show the permissible errors over the flow range.
In this case the meter specification is 0 to 1 l/min, ±0.5% of reading. In practice, this meter exceeds the specification having a linearity of +0.28% – 0.1% and a repeatability of better than ±0.1%.
Conclusion
Whereas turbine flow meters, such as Titan’s Beverage flow meter and 800 series, offer the high level of repeatability and reliability required for accurate batch delivery systems, the Atrato® and Metraflow® ultrasonic flow sensors and the larger oval gear flow meters, are highly accurate over wider flow ranges, especially with viscous liquids such as oils.
Neil Hannay, Senior R&D Engineer at Titan Enterprises, suggests: “When customers are deciding on appropriate flow meters to suit their application, they need to be aware of the difference between FSD and ‘of reading’ accuracy as often suppliers do not specify which accuracy is being quoted for. As discussed here, linearity reading has a significant impact on the flowmeter performance, particularly at the low end of its flow range.”
To reference the graphs cited here please visit https://www.flowmeters.co.uk/titan-explains-the-factors-that-determine-flow-meter-performance/


